Visualize Your Data#
![]()
In this notebook example, we’ll take a look at Datumaro visualization Python API. Specifically, we are going to provide the example codes for instance segmentation and captioning tasks with MS-COCO 2017 dataset.
Prerequisite#
Download COCO 2017 validation dataset#
[2]:
!mkdir coco_dataset
!curl http://images.cocodataset.org/zips/val2017.zip --output coco_dataset/val2017.zip --silent
!curl http://images.cocodataset.org/annotations/annotations_trainval2017.zip --output coco_dataset/annotations_trainval2017.zip --silent
!curl http://images.cocodataset.org/annotations/panoptic_annotations_trainval2017.zip --output coco_dataset/panoptic_annotations_trainval2017.zip --silent
  % Total    % Received % Xferd  Average Speed   Time    Time     Time  Current
                                 Dload  Upload   Total   Spent    Left  Speed
100  777M  100  777M    0     0  2997k      0  0:04:25  0:04:25 --:--:-- 7251k0:31  0:00:10  0:20:21  913k
  % Total    % Received % Xferd  Average Speed   Time    Time     Time  Current
                                 Dload  Upload   Total   Spent    Left  Speed
100  241M  100  241M    0     0  3601k      0  0:01:08  0:01:08 --:--:-- 4707k
  % Total    % Received % Xferd  Average Speed   Time    Time     Time  Current
                                 Dload  Upload   Total   Spent    Left  Speed
100  820M  100  820M    0     0  3661k      0  0:03:49  0:03:49 --:--:-- 4215k
Extract the downloaded dataset#
We extract all the downloaded files and remove train2017 annotation files (e.g., instances_train2017.json) because we only downloaded the val2017 images. After running this cell, you will get the following directory structure.
coco_dataset
├── annotations
│   ├── captions_val2017.json
│   ├── instances_val2017.json
│   ├── panoptic_val2017
│   ├── panoptic_val2017.json
│   └── person_keypoints_val2017.json
├── images
│   └── val2017
[1]:
!unzip -q coco_dataset/val2017.zip -d coco_dataset/images
!unzip -q coco_dataset/annotations_trainval2017.zip -d coco_dataset
!unzip -q coco_dataset/panoptic_annotations_trainval2017.zip -d coco_dataset
!unzip -q coco_dataset/annotations/panoptic_val2017.zip -d coco_dataset/annotations
!find coco_dataset -name "*_train2017.json" | xargs rm
Visualize dataset#
Visualize COCO instance segmentation dataset#
[1]:
# Copyright (C) 2021 Intel Corporation
#
# SPDX-License-Identifier: MIT

import datumaro as dm

dataset = dm.Dataset.import_from("coco_dataset", format="coco_instances")
print("Subset candidates:", dataset.subsets().keys())
subset = list(dataset.subsets().keys())[0]  # val2017
print("Subset:", subset)
WARNING:root:File 'coco_dataset/annotations/panoptic_val2017.json' was skipped, could't match this file with any of these tasks: coco_instances
WARNING:root:File 'coco_dataset/annotations/person_keypoints_val2017.json' was skipped, could't match this file with any of these tasks: coco_instances
WARNING:root:File 'coco_dataset/annotations/captions_val2017.json' was skipped, could't match this file with any of these tasks: coco_instances
Subset candidates: dict_keys(['val2017'])
Subset: val2017
[2]:
def get_ids(dataset: dm.Dataset, subset: str):
    ids = []
    for item in dataset:
        if item.subset == subset:
            ids += [item.id]

    return ids


ids = get_ids(dataset, subset)
print("DatasetItem ids:", ids[:4])
DatasetItem ids: ['000000397133', '000000037777', '000000252219', '000000087038']
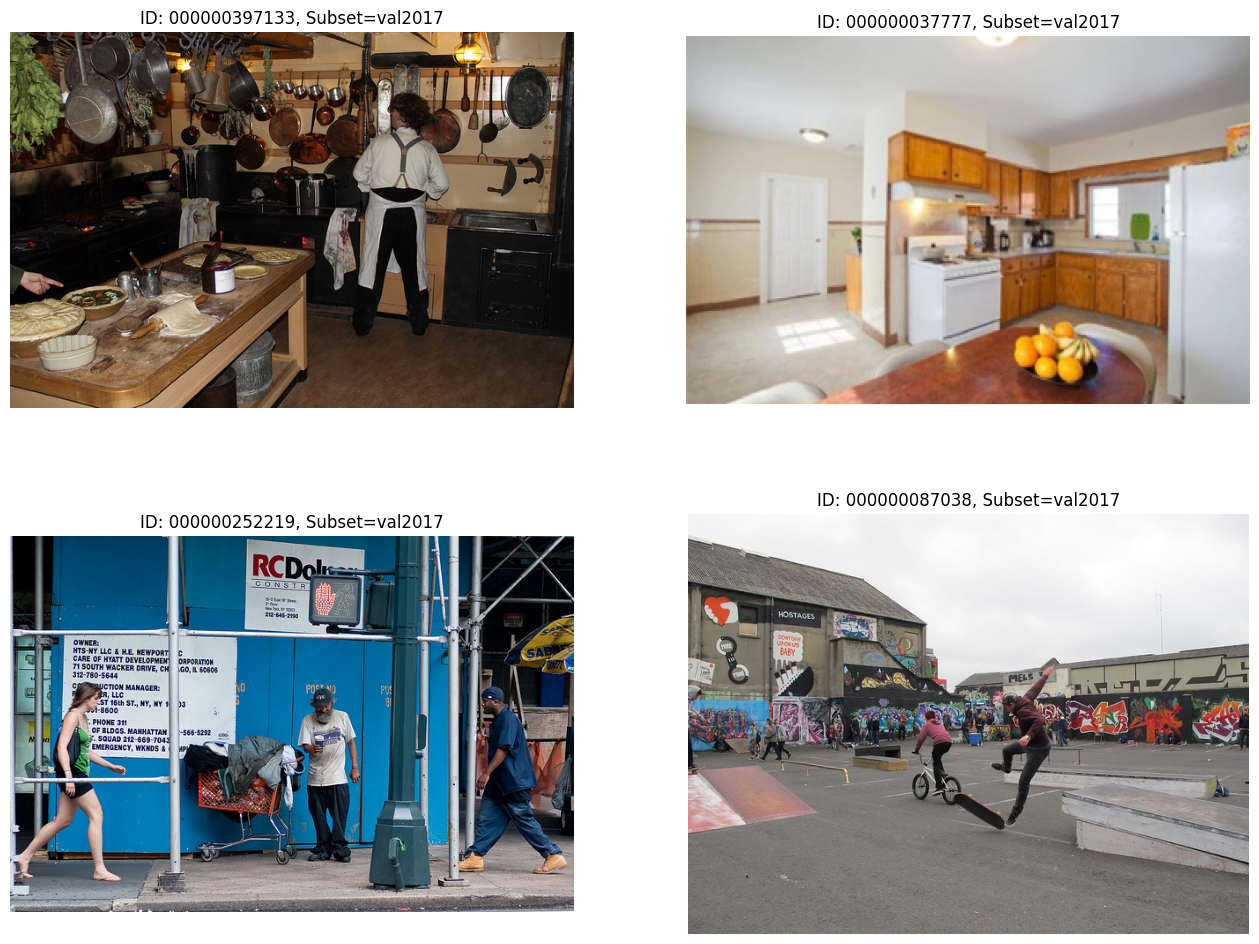
In this cell, we only draw 4 images (ids[:4]) without any annotations (setting alpha=0).
[3]:
visualizer = dm.Visualizer(dataset, figsize=(16, 12), alpha=0)
fig = visualizer.vis_gallery(ids[:4], subset, (None, None))
fig.show()
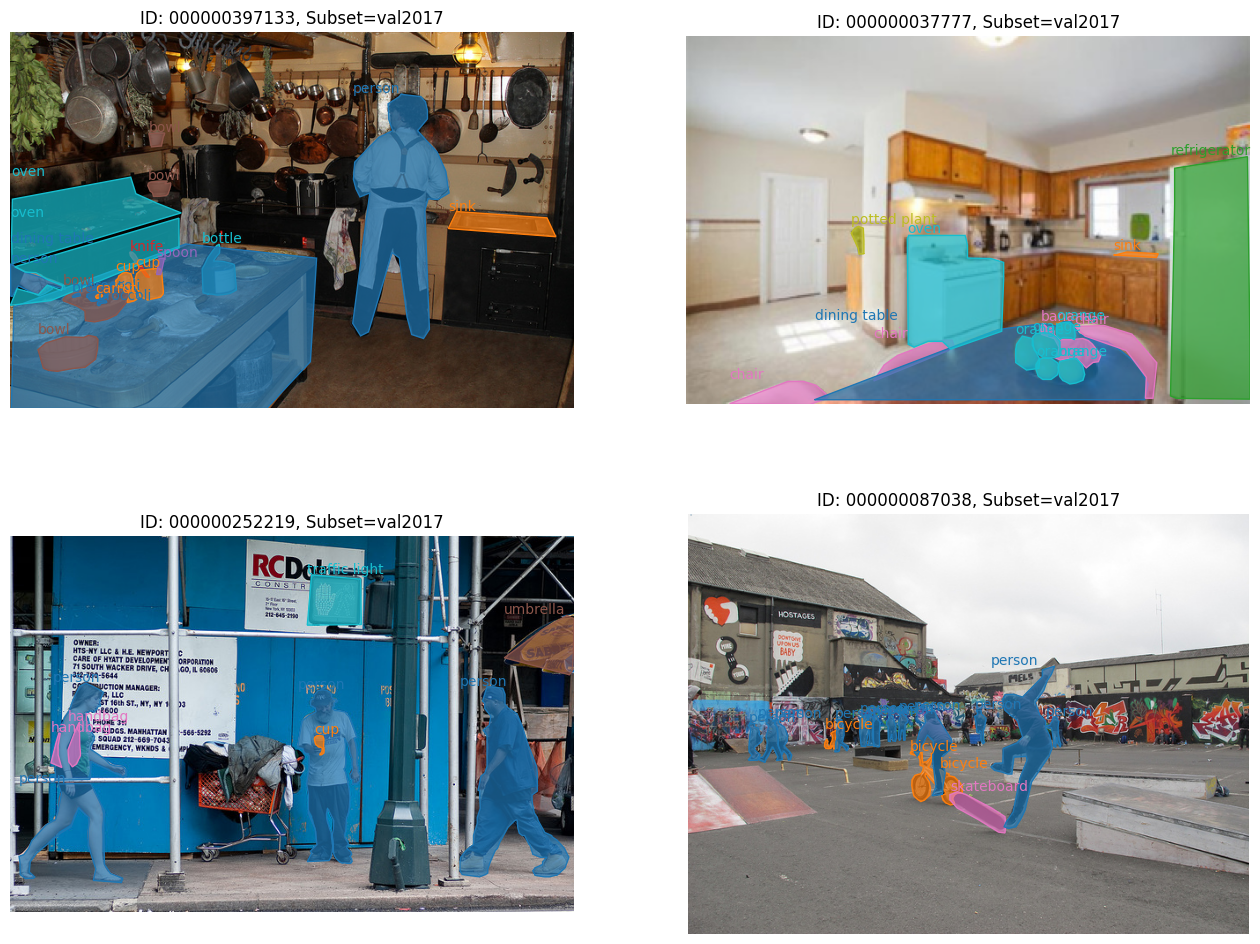
In this time, we’ll draw polygon annotations (instance segmentation task) by setting alpha=0.7. It will automatically infer the grid size of gallery as (2, 2) from the number of input samples.
[4]:
visualizer = dm.Visualizer(dataset, figsize=(16, 12), alpha=0.7)
fig = visualizer.vis_gallery(ids[:4], subset, grid_size=(None, None))
fig.show()
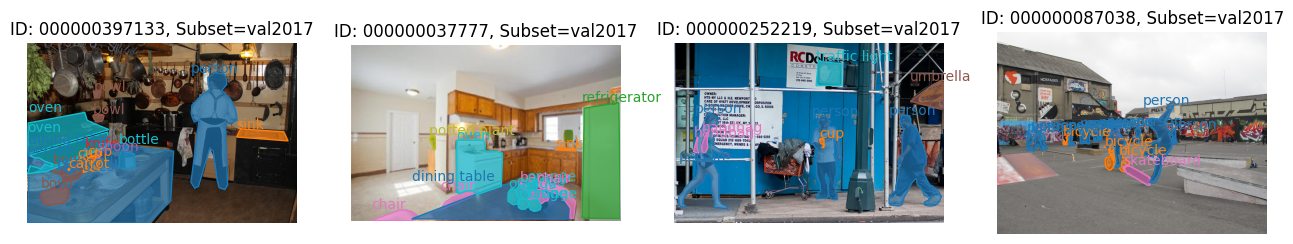
In this example, we draw 4 samples in a row. Thus, the gallery has a (1, 4) grid by giving grid_size=(1, 4).
[5]:
visualizer = dm.Visualizer(dataset, figsize=(16, 8), alpha=0.7)
fig = visualizer.vis_gallery(ids[:4], subset, grid_size=(1, 4))
fig.show()
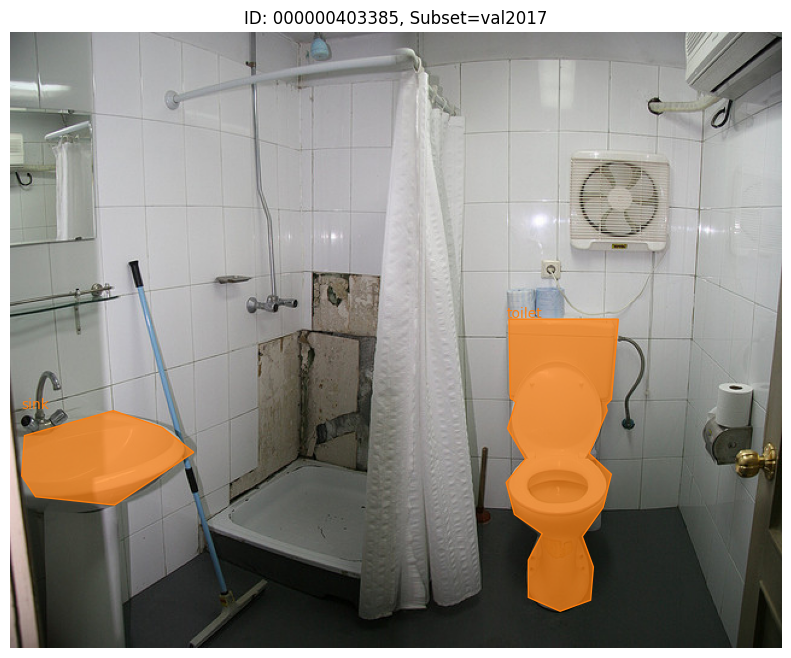
It is also possible to visualize a sample one by one.
[6]:
fig = visualizer.vis_one_sample(ids[5], subset)
fig.show()
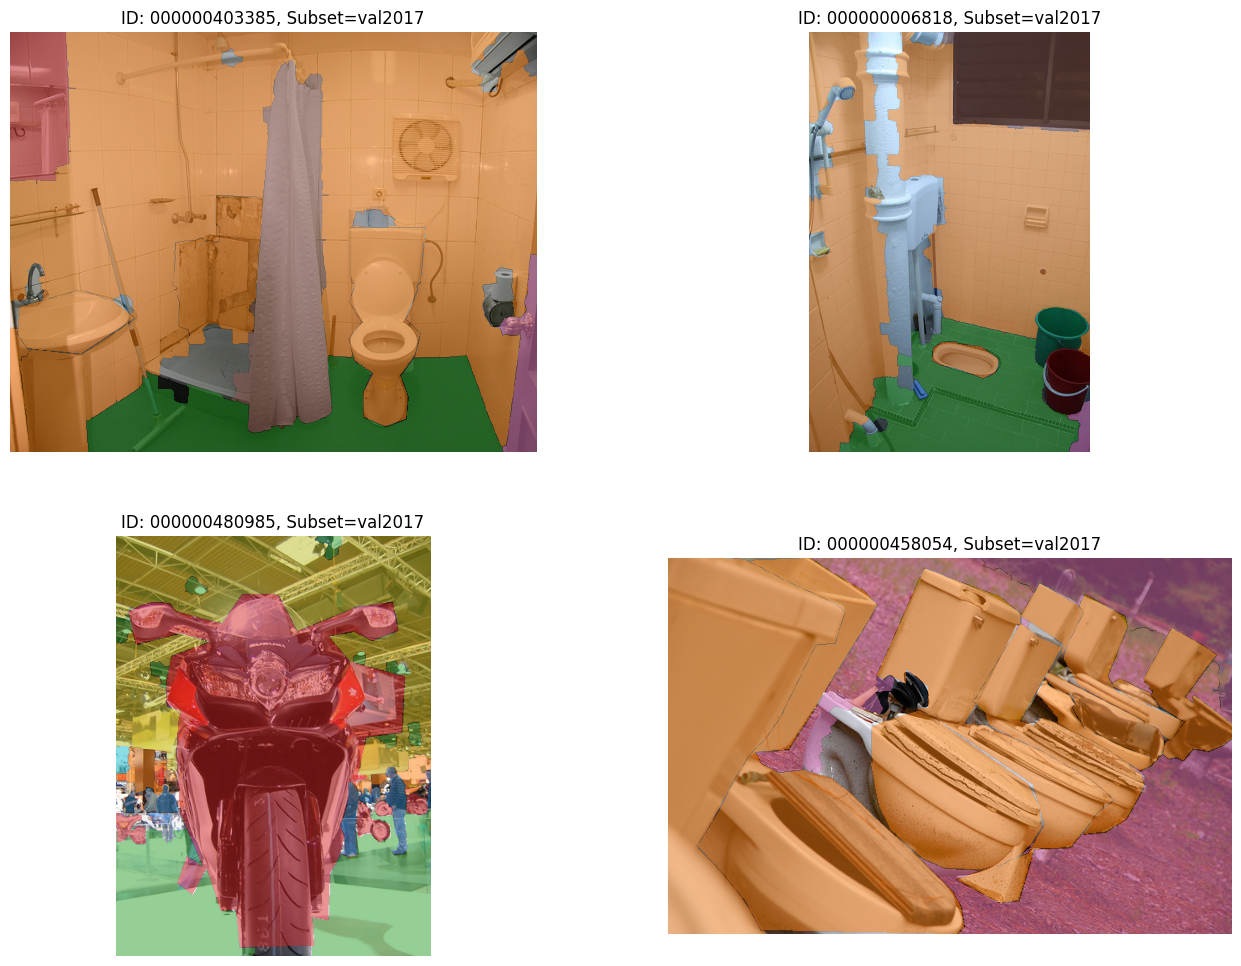
Visualize COCO panoptic segmentation dataset#
[8]:
dataset = dm.Dataset.import_from("coco_dataset", format="coco_panoptic")
ids = get_ids(dataset, subset)
print("DatasetItem ids:", ids[5:9])

visualizer = dm.Visualizer(dataset, figsize=(16, 12), alpha=0.5)
fig = visualizer.vis_gallery(ids[5:9], subset, grid_size=(None, None))
fig.show()
WARNING:root:File 'coco_dataset/annotations/instances_val2017.json' was skipped, could't match this file with any of these tasks: coco_panoptic
WARNING:root:File 'coco_dataset/annotations/person_keypoints_val2017.json' was skipped, could't match this file with any of these tasks: coco_panoptic
WARNING:root:File 'coco_dataset/annotations/captions_val2017.json' was skipped, could't match this file with any of these tasks: coco_panoptic
DatasetItem ids: ['000000403385', '000000006818', '000000480985', '000000458054']
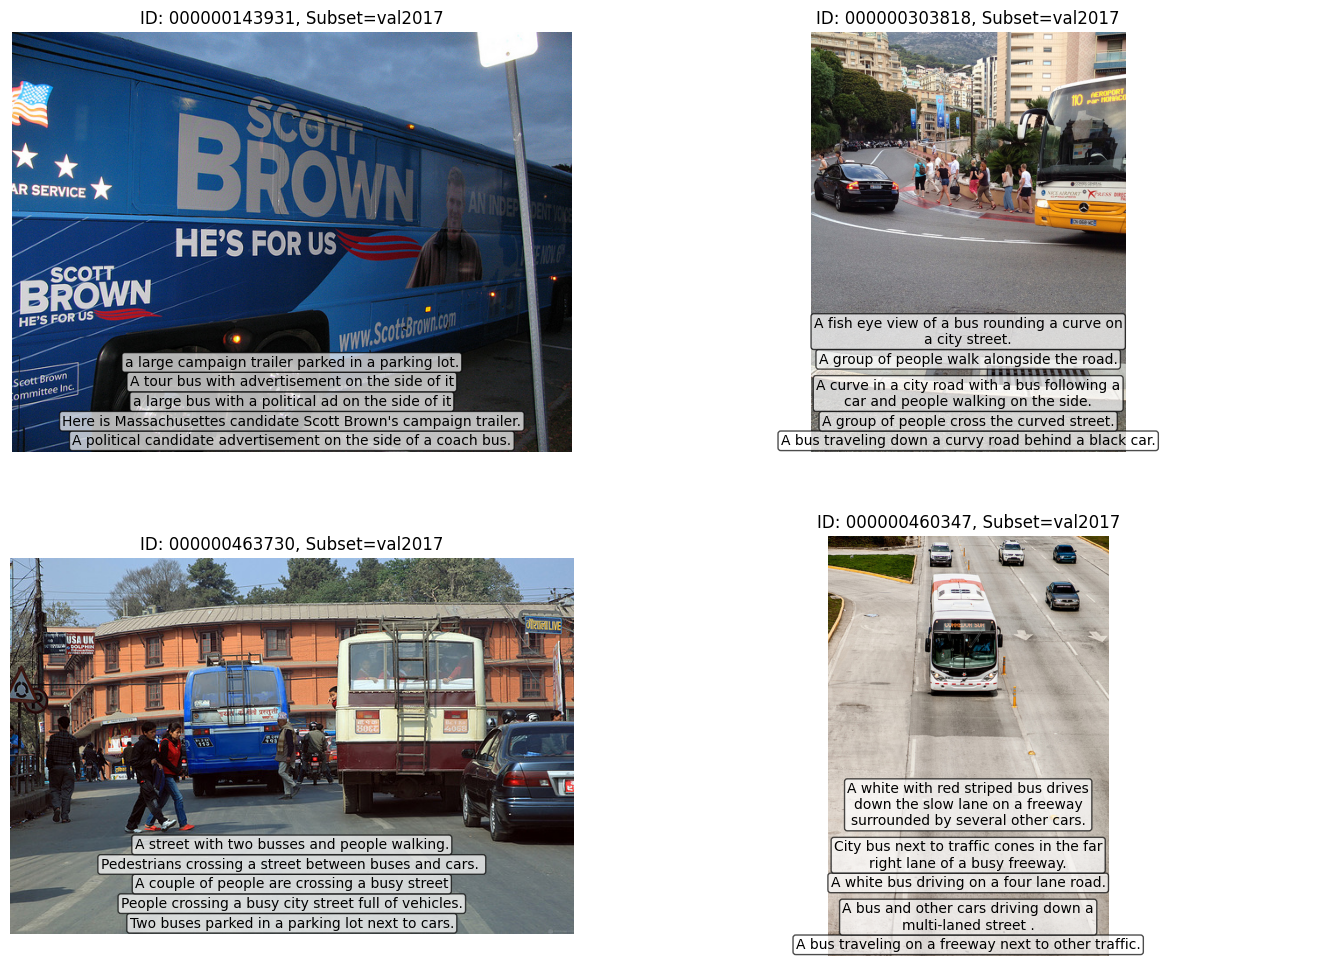
Visualize COCO captions dataset#
[9]:
dataset = dm.Dataset.import_from("coco_dataset", format="coco_captions")
ids = get_ids(dataset, subset)
print("DatasetItem ids:", ids[20:24])

visualizer = dm.Visualizer(dataset, figsize=(16, 12), alpha=0.7)
fig = visualizer.vis_gallery(ids[20:24], subset, grid_size=(None, None))
fig.show()
WARNING:root:File 'coco_dataset/annotations/panoptic_val2017.json' was skipped, could't match this file with any of these tasks: coco_captions
WARNING:root:File 'coco_dataset/annotations/instances_val2017.json' was skipped, could't match this file with any of these tasks: coco_captions
WARNING:root:File 'coco_dataset/annotations/person_keypoints_val2017.json' was skipped, could't match this file with any of these tasks: coco_captions
DatasetItem ids: ['000000143931', '000000303818', '000000463730', '000000460347']