Validate Dataset To Detect Anomalies#
![]()
In this notebook example, we are going to generate the validation report, which contains types of anomaly data regarding to validate. Through this, we can identify which data was inapplicable for DL workflow because it is broken or undefined. Moreover, we detect imbalanced, out-of-distributed, or rare samples together.
Prerequisite#
Download COCO 2017 validation dataset#
Please refer this notebook for preparing COCO 2017 validation dataset.
[1]:
from datumaro.components.dataset import Dataset

path = "coco_dataset"
dataset = Dataset.import_from(path, "coco_instances")

print("Representation for sample COCO dataset")
dataset
WARNING:root:File 'coco_dataset/annotations/panoptic_val2017.json' was skipped, could't match this file with any of these tasks: coco_instances
WARNING:root:File 'coco_dataset/annotations/person_keypoints_val2017.json' was skipped, could't match this file with any of these tasks: coco_instances
WARNING:root:File 'coco_dataset/annotations/captions_val2017.json' was skipped, could't match this file with any of these tasks: coco_instances
Representation for sample COCO dataset
[1]:
Dataset
        size=5000
        source_path=coco_dataset
        media_type=<class 'datumaro.components.media.Image'>
        annotated_items_count=4952
        annotations_count=78647
subsets
        val2017: # of items=5000, # of annotated items=4952, # of annotations=78647, annotation types=['mask', 'bbox', 'polygon']
infos
        categories
        label: ['person', 'bicycle', 'car', 'motorcycle', 'airplane', 'bus', 'train', 'truck', 'boat', 'traffic light', 'fire hydrant', 'stop sign', 'parking meter', 'bench', 'bird', 'cat', 'dog', 'horse', 'sheep', 'cow', 'elephant', 'bear', 'zebra', 'giraffe', 'backpack', 'umbrella', 'handbag', 'tie', 'suitcase', 'frisbee', 'skis', 'snowboard', 'sports ball', 'kite', 'baseball bat', 'baseball glove', 'skateboard', 'surfboard', 'tennis racket', 'bottle', 'wine glass', 'cup', 'fork', 'knife', 'spoon', 'bowl', 'banana', 'apple', 'sandwich', 'orange', 'broccoli', 'carrot', 'hot dog', 'pizza', 'donut', 'cake', 'chair', 'couch', 'potted plant', 'bed', 'dining table', 'toilet', 'tv', 'laptop', 'mouse', 'remote', 'keyboard', 'cell phone', 'microwave', 'oven', 'toaster', 'sink', 'refrigerator', 'book', 'clock', 'vase', 'scissors', 'teddy bear', 'hair drier', 'toothbrush']
Generate the validation report#
We first generate the validation report with given conditions. The few_sample_thr warns users when the number of samples per class is less than a given threshold. The imbalance_ratio_thr warns users when the imbalance ratio, which is calculated by dividing the number of samples corresponding to the majority class by the number of samples corresponding to the minority class, is larger than a given threshold. The far_from_mean_thr defines the threshold \(x\) for warning annotations
if it exceeds mean \(\pm\) x * stddev
[2]:
from datumaro.plugins.validators import DetectionValidator

extra_args = {
    "few_samples_thr": 100,
    "imbalance_ratio_thr": 5,
    "far_from_mean_thr": 20.0,
}

validator = DetectionValidator(**extra_args)


def validate(dataset):
    reports = validator.validate(dataset)

    print("Validation report summary:", reports["summary"])

    error_cnt = {}
    warning_cnt = {}
    for report in reports["validation_reports"]:
        if report["severity"] == "error":
            type = report["anomaly_type"]
            if error_cnt.get(type) is None:
                error_cnt[type] = 1
            else:
                error_cnt[type] += 1
        if report["severity"] == "warning":
            type = report["anomaly_type"]
            if warning_cnt.get(type) is None:
                warning_cnt[type] = 1
            else:
                warning_cnt[type] += 1
    print("The number of errors per error type: ", error_cnt)
    print("The number of warnings per warning type: ", warning_cnt)

    return reports


reports = validate(dataset)
Validation report summary: {'errors': 36782, 'warnings': 122}
The number of errors per error type:  {'UndefinedAttribute': 36781, 'NegativeLength': 1}
The number of warnings per warning type:  {'MissingAnnotation': 48, 'FewSamplesInLabel': 9, 'ImbalancedLabels': 1, 'ImbalancedDistInLabel': 59, 'FarFromLabelMean': 5}
We here checked that most of errors are coming from the UnderfinedAttribute. This is because, the attribute of MS-COCO dataset, i.e., is_crowd, is not defined in metadata. We are going to provide the validation description and the visualization of NegativeLength sample below.
[3]:
import numpy as np
import cv2
from matplotlib import pyplot as plt
from datumaro.components.annotation import AnnotationType, LabelCategories

label_categories = dataset.categories().get(AnnotationType.label, LabelCategories())


def visualize_label_id(item, label_id=None):
    img = item.media.data.astype(np.uint8)
    img = cv2.cvtColor(img, cv2.COLOR_BGR2RGB)

    for ann in item.annotations:
        if not label_id:
            continue
        if ann.id == label_id:
            x, y, w, h = ann.get_bbox()
            label_name = label_categories[ann.label].name
            x1, y1, x2, y2 = int(x), int(y), int(x + w), int(y + h)
            cv2.rectangle(img, (x1, y1), (x2, y2), (255, 0, 0), 1)
            cv2.putText(img, label_name, (x1, y1 - 5), cv2.FONT_HERSHEY_SIMPLEX, 1, (255, 0, 0))

    plt.imshow(img)
    plt.axis("off")
    plt.show()


for report in reports["validation_reports"]:
    if report["anomaly_type"] == "NegativeLength":
        item = dataset.get(report["item_id"], report["subset"])
        label_id = [int(s) for s in str.split(report["description"], "'") if s.isdigit()][0]
        visualize_label_id(item, label_id)

Manual correction of validation errors#
From now on, we are going to fix the dataset from reported errors. For the UnderfinedAttribute, we will update the label information of the dataset with the attributes as below. Meanwhile, we will remove the NegativeLength by rejecting the specific label from annotations in the sample.
[4]:
from datumaro.components.annotation import AnnotationType, LabelCategories

label_categories = dataset.categories().get(AnnotationType.label, LabelCategories())

for report in reports["validation_reports"]:
    if report["anomaly_type"] == "UndefinedAttribute":
        item = dataset.get(report["item_id"], report["subset"])
        for ann in item.annotations:
            for k in ann.attributes.keys():
                label_categories[ann.label].attributes.add(k)

    if report["anomaly_type"] == "NegativeLength":
        item = dataset.get(report["item_id"], report["subset"])
        print(report["description"])
        label_id = [int(s) for s in str.split(report["description"], "'") if s.isdigit()][0]
        neg_len_anns = []
        for ann in item.annotations:
            if ann.id == label_id:
                neg_len_anns.append(ann)
        for ann in neg_len_anns:
            item.annotations.remove(ann)

reports = validate(dataset)
Annotation '2202383' in the item should have a positive value of 'bounding box height' but got '0.86'.
Validation report summary: {'errors': 0, 'warnings': 347}
The number of errors per error type:  {}
The number of warnings per warning type:  {'MissingAnnotation': 48, 'FewSamplesInLabel': 9, 'ImbalancedLabels': 1, 'FewSamplesInAttribute': 50, 'ImbalancedAttribute': 42, 'OnlyOneAttributeValue': 38, 'ImbalancedDistInLabel': 59, 'ImbalancedDistInAttribute': 93, 'FarFromLabelMean': 5, 'FarFromAttrMean': 2}
Inspection of warnings#
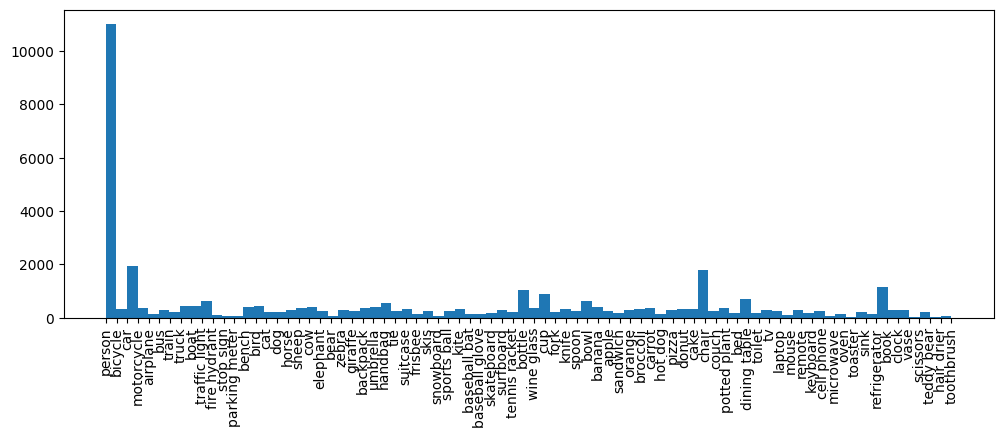
Although the severe errors have been fixed above, it is still important to address the warnings because they may contain potential annotation errors. Datumaro provides a report to users by checking if the labels in the dataset are imbalanced through ImbalancedLabels or if certain annotations deviate significantly from the distribution FarFromLabelMean. It is crucial to review and address these warnings to ensure the quality and accuracy of the dataset. We are going to start from the
label distribution of MS-COCO validation dataset.
[5]:
for report in reports["validation_reports"]:
    if report["anomaly_type"] == "ImbalancedLabels":
        print(report["description"])

stats = reports["statistics"]

label_stats = stats["label_distribution"]["defined_labels"]
label_name, label_counts = zip(*[(k, v) for k, v in label_stats.items()])

plt.figure(figsize=(12, 4))
plt.hist(label_name, weights=label_counts, bins=len(label_name))
plt.xticks(rotation="vertical")
plt.show()
There is an imbalance in the label distribution.
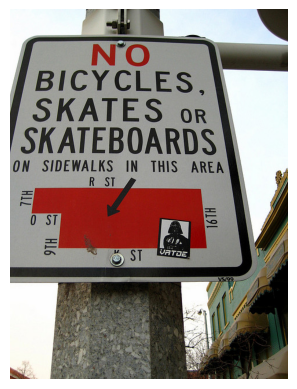
We will then visualize the MissingAnnotation samples below.
[6]:
missing_annotations = []
for report in reports["validation_reports"]:
    if report["anomaly_type"] == "MissingAnnotation":
        missing_annotations.append(dataset.get(report["item_id"], report["subset"]))

visualize_label_id(missing_annotations[0])
We now show the samples with the FarFromLabelMean warning.
[7]:
for report in reports["validation_reports"]:
    if report["anomaly_type"] == "FarFromLabelMean":
        print(report["description"])
        item = dataset.get(report["item_id"], report["subset"])
        label_id = [int(s) for s in str.split(report["description"], "'") if s.isdigit()][0]
        visualize_label_id(item, label_id)
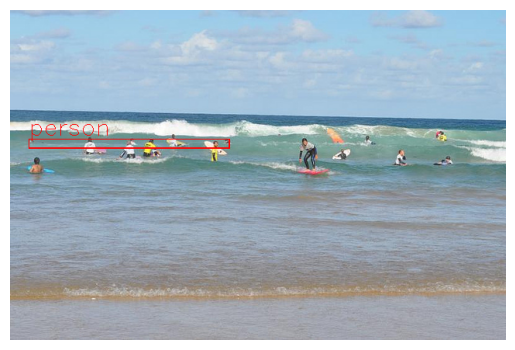
Annotation '900100474028' in the item has a value of 'bounding box ratio(w/h)' that is too far from the label average. (mean of 'person' label: 0.7, got '16.77').

Annotation '900100325031' in the item has a value of 'bounding box ratio(w/h)' that is too far from the label average. (mean of 'person' label: 0.7, got '19.72').
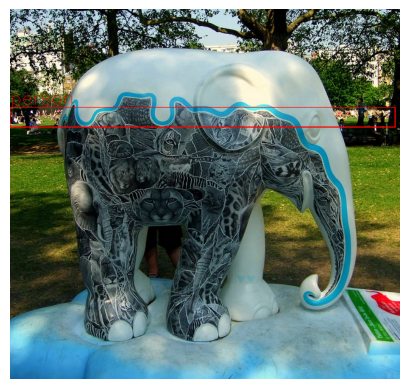
Annotation '900100332351' in the item has a value of 'bounding box ratio(w/h)' that is too far from the label average. (mean of 'person' label: 0.7, got '23.45').
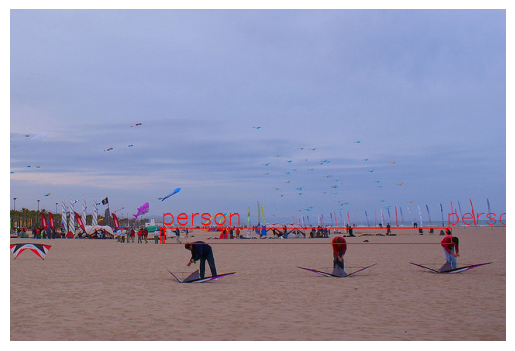
Annotation '1330416' in the item has a value of 'bounding box ratio(w/h)' that is too far from the label average. (mean of 'person' label: 0.7, got '18.76').
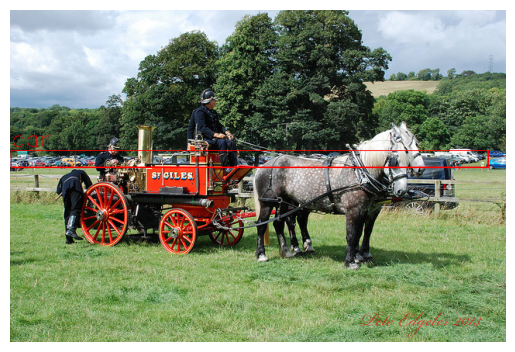
Annotation '900300121242' in the item has a value of 'bounding box ratio(w/h)' that is too far from the label average. (mean of 'car' label: 1.67, got '29.29').
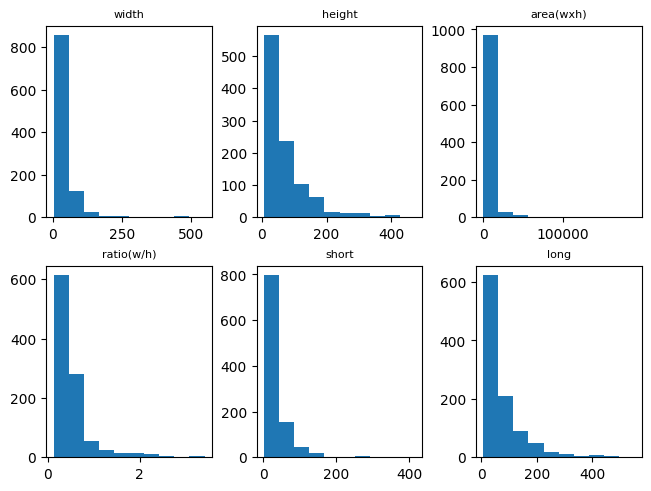
Specifically, we can draw the detailed statistics with 6 types of properties, i.e., width, height, area, ratio, short, and long, per each label.
[8]:
bottle_bbox_dist = stats["point_distribution_in_label"]["bottle"]

fig, axs = plt.subplots(2, 3, layout="constrained")

properties = list(bottle_bbox_dist.keys())
for prop, ax in zip(properties, axs.flat):
    bins = bottle_bbox_dist[prop]["histogram"]["bins"]
    counts = bottle_bbox_dist[prop]["histogram"]["counts"]
    ax.hist(bins[:-1], bins, weights=counts)
    ax.set_title(prop, fontsize=8)